What Happens If We Lose GPS?
GPS · Satellite Navigation · Infrastructure
4 min read
What happens when GPS signals fail? See how navigation and mobile networks respond, how long backup clocks can last, and what a prolonged outage could cost.
Complex space research and policy debates often depend on technical data that is difficult to follow in dense reports. I design infographics to make those figures clear, comparable, and easier to question. That’s one part of space fluency.
I draw on my editorial and computational background to explain how orbital systems, space infrastructure, or regulatory proposals work in practice. Every graphic is accompanied by a short analytical note explaining where the data comes from, what its limits are, and where to find the primary research.
GPS · Satellite Navigation · Infrastructure
4 min read
What happens when GPS signals fail? See how navigation and mobile networks respond, how long backup clocks can last, and what a prolonged outage could cost.
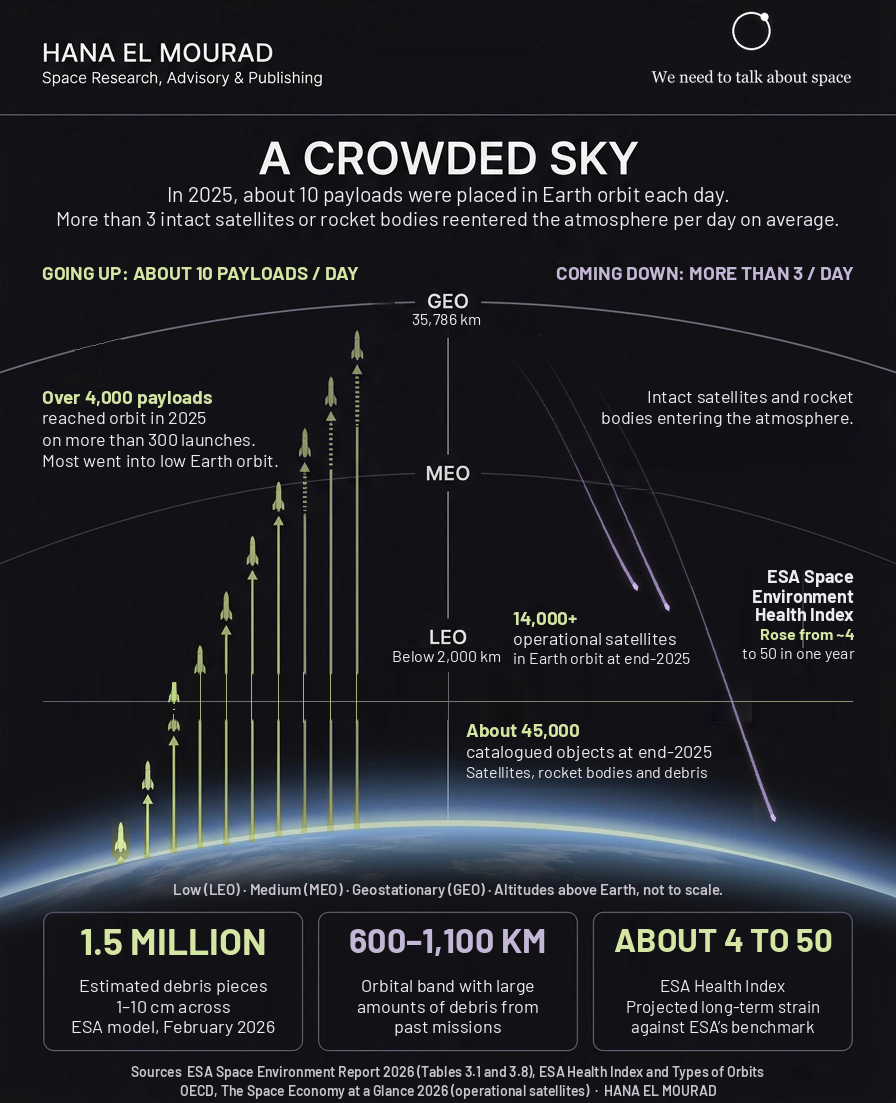
Space Debris · Satellite Reentry · Orbital Sustainability
4 min read
Why does space debris keep growing as more satellites reenter Earth’s atmosphere? ESA data explain the risks in low Earth orbit and what operators can do.